Deflategate follow up: Game charts for all 30 NBA teams
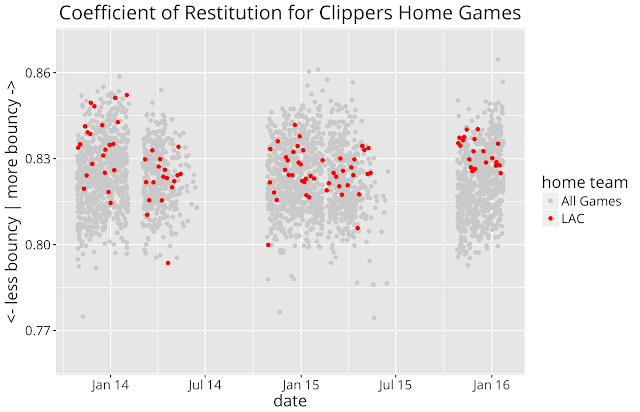
In my NBA deflategate analysis, I shared charts for several teams that showed game by game coefficient of restitution for home games. Coefficient of restitution is a measurement of the ball's "bounciness". The point was to see if there is evidence of certain teams either over or under inflating their game balls.
As I called out in that post, there is no clear evidence of cheating in the data, but there do appear to be home teams that show a clear bias to one end of the bounciness range. You can see for yourself in the charts below which teams those are.
Each red dot represents a home game for the particular team. The gray dots are all NBA games for which I have data, and help provide context as to whether a team is an outlier.


Leave a Comment